January 30th, 2025
One Sample T-Test Definition and Guide
By Connor Martin · 12 min read

You have a normal population from which you want to determine the mean value for a random sample. A one-sample t-test can help you do that as long as you stick within the strict parameters of this form of statistical analysis.
Here, we examine what this practical test actually does and under what conditions you can use it.
Key Takeaways
- A one-sample t-test evaluates whether the mean of a single dataset differs significantly from a known or hypothesized population mean.
- This test is best suited for small datasets (30 or fewer observations) and requires data to meet normality assumptions.
- Statistical tools and software can help automate calculations, ensuring accurate results and saving time.
What Is a One-Sample T-Test?
In a nutshell, every type of t-test allows you to figure out what, if any, difference exists between the means of two datasets at most. We say “at most” because it’s possible to run a t-test on a single set of sample data – this is a one-sample t-test, also known as a one-tailed test. You typically use this test to determine if there is a difference between your assumed mean in a random dataset – your null hypothesis – and the actual mean.
Variables are always numeric – such as age or height – in a one-sample t-test, with the test also only generally being used for smaller datasets. Limit yourself to a sample size of 30 or less, and you’ll find the one-sample t-test to be a handy tool for statistical analysis.
Degrees of freedom play a role in this type of statistical testing. Those degrees amount to the number of observations you’ve derived from your dataset minus one. Sample standard deviation is also used in a one-sample t-test. It has to be – you’re only using one sample and won’t have any other form of standard deviation available.
Understanding the Basics of a One-Sample T-Test
Why Use a One-Sample T-Test?
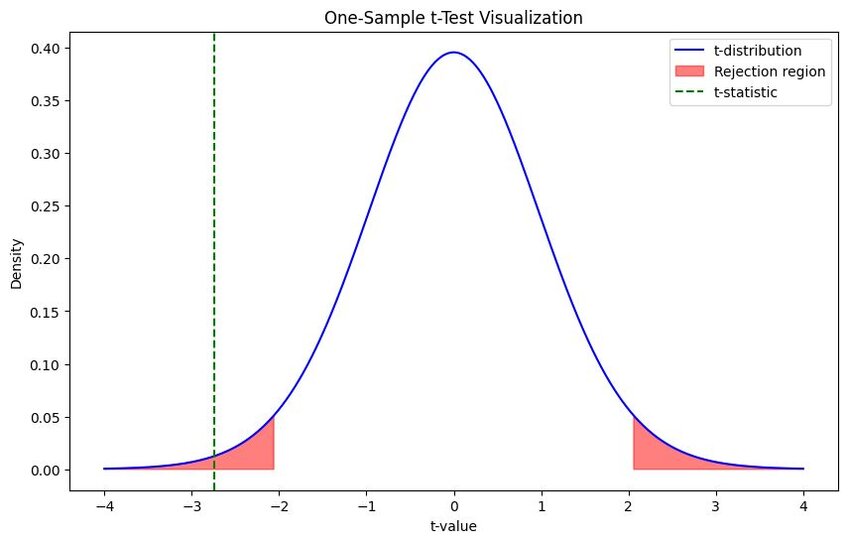
Your aim with a one-sample t-test is to compare your hypothesized mean with the mean you derive from your sample data using the test. That gives you a t-value (or t-score) to represent the difference between these two values, assuming a difference exists.
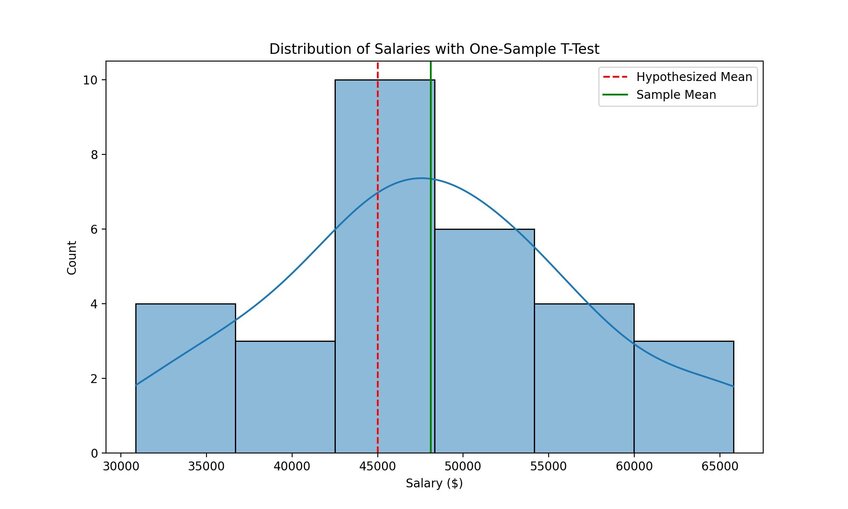
This test provides answers to questions about a single dataset. For instance, let’s say you have a list of salaries for people working in the same role in a specific industry. You may believe you know the mean or average wage for that role, which would be your null hypothesis.
After extracting up to 30 random salaries from your dataset, you can run a t-test to find the mean those salaries deliver – your alternative hypothesis. Further calculations to determine the t value reveal what, if any, difference exists between the two. You thus determine if your original hypothesis is valid or if the data tells you something new.

Breaking Down the Formula
Running a one-sample t-test means getting comfortable with formulas as with any statistical test.
Null Hypothesis and Alternative Hypothesis
These two hypotheses aren’t necessarily formulas. They represent what you believe to be accurate and the possible alternative. In a one-sample t-test, your null hypothesis is usually that your t-score will equal 0, meaning there’s no difference between the mean you’ve hypothesized and what the data shows. So, your alternative hypothesis is that there is a difference, meaning the t-value will not be equal to 0.
Standard Error of the Mean Formula
You start by using your sample standard deviation to work out the standard error for your one-sample t-test. Use the following formula where:
x̅ = Mean Value in a Sample
sx̅ = Standard Error
n = Number of Observations in a Sample
μ = Hypothesized Mean
s = Sample Standard Deviation
Complete the following equation:
sx̅ = s / Ön
T-Value Formula
With your standard error discovered, you can move on to finding the t-value for your sample. In the following formula, the values assigned above all still apply, with “t” standing for t-value.
t = x̅ - μ / sx̅
Alternatively, you can skip the whole working out the standard error phase and incorporate that element into your t-value formula as follows:
t = (x̅-μ) / (s/√n)
P-Value
You’re not done once you have your t-value. You have to find your probability value (p-value). This allows you to quantify the evidence you’ve gathered against your null hypothesis, enabling you to determine the significance of your results. In other words, how likely is it that the data you’ve generated will occur by random chance?
P-values are usually expressed between 0 and 1, with smaller p-values suggesting a low likelihood of your results occurring by random chance. That’s not what you want with a one-sample t-test. Remember that your sample data is supposed to be random. If you get a low p-value – typically between 0.01 and 0.05 – you demonstrate that your null hypothesis is likely faulty.
As for figuring out the p-value, you need to use a t-distribution table that accounts for the degrees of freedom permitted in a one-sample t-test. That’s a tricky task. Using an online calculator or statistical testing software like Julius AI is recommended for this final set of calculations.
Tips for Accurate Calculations
The above formulas give you your calculated t-value. This number represents whether the specified value for your null hypothesis – i.e., what you think the mean of a sample will be – aligns with the alternative hypothesis. Therein lies our first tip for accurate calculation – a t-value of 0 means that no difference exists. Anything higher or lower indicates that your null hypothesis doesn’t match the alternative hypothesis the one-sample t-test produced.
Beyond that, make sure you’ve accurately counted the number of observations in your sample. Mistakes here will lead to miscalculations for your standard error, giving you an inaccurate t-value.
Assumptions of the One-Sample T-Test
One-sample t-tests aren’t usable in every case where you want to establish the mean of a sample dataset. There are assumptions that need to be made – all have to be true to run this test successfully.
Normality of Data
Your sample data must demonstrate normal distribution. That means the sample has to match the Gaussian distribution bell curve. If it doesn’t, you likely have such wild variations within your sample that they will completely distort your mean value.
With our salary example from above, you may have somebody in the sector who gets paid far more (or far less) than most. Normality of data isn’t possible there, suggesting there’s a data object you need to reject from your sample.
Random Sampling
Speaking of sampling, you have to choose randomly. It’s the only way to ensure you draw valid conclusions. A non-random sample doesn’t truly represent the population you’re studying – you may introduce bias by picking and choosing specific data objects – meaning you get a distorted result.
Continuous Data Requirement
Continuous data is numeric and can involve complex numbers. Take height, for example. It’s measured in feet and inches or meters and centimeters, and each approach rarely delivers whole numbers. T-tests of all types require continuous data.
How to Conduct a One-Sample T-Test in 4 Steps
Step 1: Define Your Hypothesis
Defining your hypothesis is the easy part. You’ll usually have a null hypothesis that says your test result will create a t-value of 0, meaning there’s no difference between your hypothesized value and the value the data shows. Your alternative hypothesis is also simple – any result that doesn’t deliver a t-value of 0 shows that there’s a difference between what you thought and what is.
Step 2: Gather and Prepare Data
Another simple step is gathering your data simply by randomly selecting up to 30 data objects from your dataset.
Step 3: Calculate the T-Statistic
You just plug your numbers into your formula in this step. Remember that this equation for a t-value in a one-sample t-test is:
t = (x̅-μ) / (s/√n)
Once you have your value for “t,” use a t-distribution table to calculate the p-value for your sample.
Step 4: Interpret the Results
P-value is established. With that number, you can compare the two alpha levels your data generated to see who (or if) they correspond with one another. These alpha values tell you whether or not it’s probable that you’ll have to reject your null hypothesis. You establish the first before going through the p-value process, usually a number between 0.1 and 0.5. Compare your p-value – which is your second alpha value – against the established value, and you have your answer about whether your null hypothesis is viable.
Practical Examples of One-Sample T-Tests
The salary example we’ve touched on already is just one of many ways you can use a one-sided t-test. There are plenty of others.
Real-World Example: Testing Average Heights
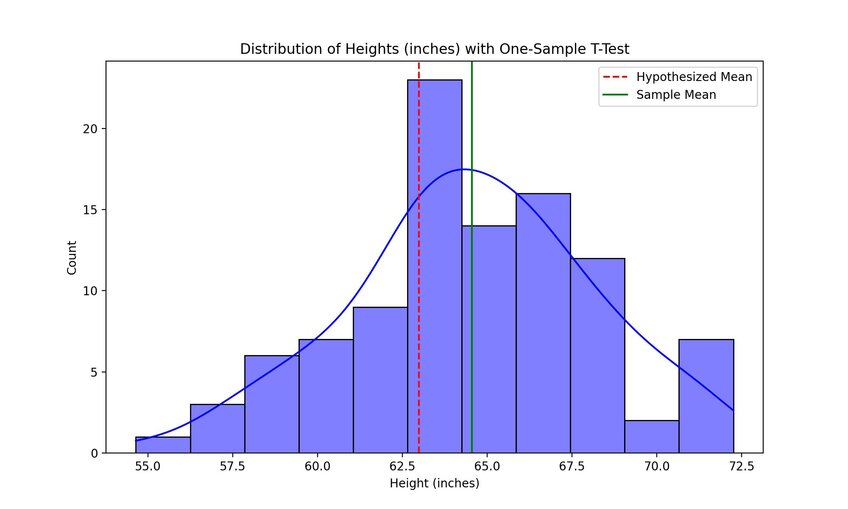
Let’s say you have a dataset containing the heights of every student in the 10th grade across multiple schools. That’s a perfect dataset for a one-sided t-test. You come up with what you believe the mean height for a 10th-grade student is – your null hypothesis – and then run your t-test.
The mean you get from the randomly selected data reveals if there is a significant height differential from your hypothesized mean and what the height data pulled from different schools shows you.

Business Use Case: Customer Satisfaction Scores
Keeping track of customer satisfaction scores is vital to a company’s success. If those cores slip too low, you have a sign of a business that’s not delivering. A one-sample t-test can be helpful here. We’ll assume your company rates customer satisfaction on a scale of 0 to 5. You may believe your mean satisfaction score is 4 – a solid score telling you that most of your customers are happy.
Your t-test shows if that null hypothesis matches what a sample of your customer scores actually tells you. Any differences could be an indicator that you need to start doing things a little differently.
Tools for Performing a One-Sample T-Test
Manual Calculations
Manual calculations mean it’s just you and a pen (or computer) when you run your t-tests. You’re drawing up your t-distribution tables for your p-values. You’re plugging your numbers into the formulas. The responsibility all rests with you – a potential recipe for mistakes.
Software Solutions
The likes of GraphPad offer calculators from which you can derive p-values from your t-values. Then, there’s Julius AI – an artificial intelligence-powered tool that allows you to chat with the data you wish to use to run your test. That chatting lets you ask for the key figures – your t and p-values – and the tool calculates for you.
Common Errors and How to Avoid Them
Two common errors people make when conducting one-sample t-tests are ignoring the assumptions built into the test and miscalculating or misinterpreting the p-value.
For the first mistake, remind yourself of the assumptions you’re supposed to make before any t-test. P-values misinterpretation is more straightforward to solve. Use “lower means by null hypothesis is probably inaccurate” as your general rule here.
Alternatives to One-Sample T-Test
Limited sample sizes (Remember: less than 30 samples per test) mean one-sample t-tests aren’t always effective. These alternatives can help in those situations.
Z-Test for Large Samples
Like a t-test, a z-test requires data with a normal distribution, along with the other assumptions we highlighted earlier. The difference comes in sample sizes – having 30 samples or more means a z-test is usually a better choice than a t-test.
Non-Parametric Alternatives
When you can’t make the assumptions you need for a one-sided t-test, a non-parametric alternative can help. Examples include the ANOVA and Mann-Whitney tests. ANOVA tests work well if you have over two sample groups – a situation for which a one-sample test can’t resolve.
Discover How Julius Can Make One-Sample T-Test and Other Statistical Analysis Simple
A traditional one-sample t-test means coming to grips with complicated formulas. Throw t-distribution tables and p-values into the mix, and you may be in trouble if you’re not a deft hand with statistics.
Your solution is available – use Julius AI to do it all for you. Uploading documents (including those containing your t-test sample data) is simple, and you’ll be able to chat with those documents once they’re uploaded. Think of it like ChatGPT for statistical analysis. You get a simple interface and can rely on AI to do calculations in seconds, rather than the hours you’d spend drawing insight from your sample data.
Run your one-sample t-tests with Julius AI – Sign up today.
Frequently Asked Questions (FAQs)
What is a one-sample t-test used for?
A one-sample t-test is used to compare the mean of a single sample dataset against a known or hypothesized population mean. This test helps determine if there is a statistically significant difference between the two means.
What is the difference between a one-sample and a two-sample t-test?
A one-sample t-test evaluates whether the mean of one sample differs from a hypothesized population mean, while a two-sample t-test compares the means of two independent datasets. The key distinction lies in the number of datasets analyzed.
Is ANOVA a one-sample t-test?
No, ANOVA is not a one-sample t-test. While both are statistical tests, ANOVA is used to compare the means of three or more groups, whereas a one-sample t-test focuses on a single sample compared to a hypothesized mean.
Why use the one-sample t-test?
The one-sample t-test is ideal for determining whether your sample mean significantly deviates from a known or assumed population mean. It’s particularly useful when working with small datasets under 30 observations and when normality assumptions are met.
