January 3, 2025
Two-Sample T-Test Definition and Guide
By Connor Martin · 6 min read

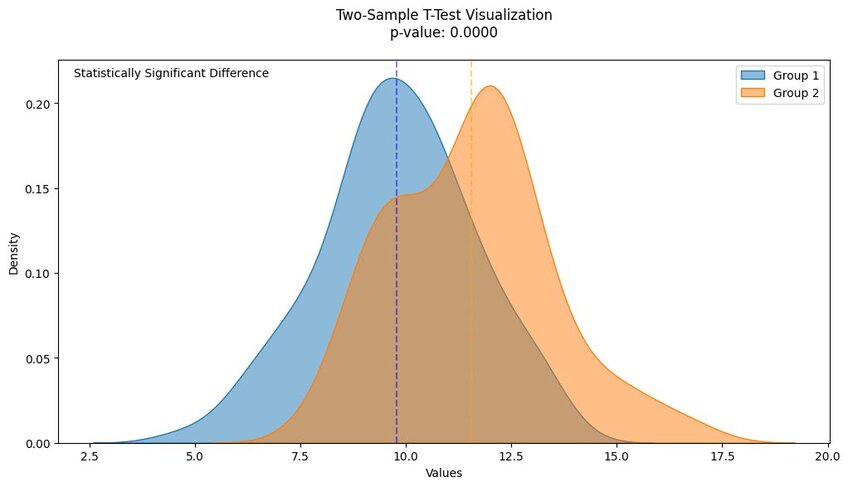
A two-sample t-test is used to test the unknown means from two data samples. Those samples may come from the same group – meaning you have two variables derived from one data set – and can come from two different groups. Think of these tests like A/B tests – stacking up the means derived from two data sets displays the relationship between them.
Key Takeaways
- A two-sample t-test determines if there is a significant difference between the means of two data samples, whether they are independent groups or paired data from the same group.
- Two types of two-sample t-tests exist—independent (for different groups) and paired (for related data). They are widely used in fields like business (A/B testing campaigns) and research (comparing class performance or sample differences).
- The test assumes normal data distribution and equal variance; if these are violated, alternatives like the Mann-Whitney U test or ANOVA (for more than two groups) should be used.
What Is a Two-Sample T-Test?
You have a pair of data samples. These may come from the same group or be samples drawn from two independent groups. With your t-test, you determine the means of each group sample and compare them to see if they correlate or are different.
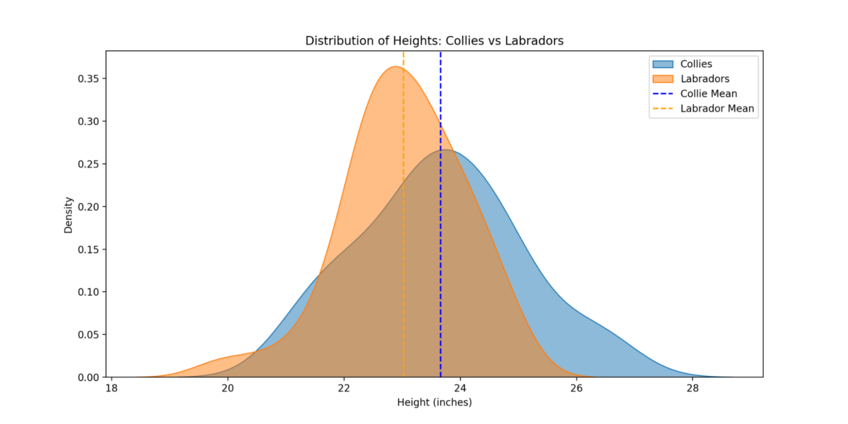
The trick comes in that there are two types of two-sample t-tests. An independent t-test sees you derive two independent samples from two different, albeit related, groups. Other breeds of dogs offer a good example. For instance, you may use an independent test to determine the difference in mean height between collies and labradors.

The other two-sample test is a “dependent” or “paired” t-test. With that version, you’re still comparing two samples, but they only come from the same dataset.
The sample size is key for both types of two-sample t-tests. Keep your samples below 30 data objects to ensure accuracy in your testing.
Understanding the Basics of a Two-Sample T-Test
Let’s move into the whys and potential applications for a two-sample t-test.
Why Use a Two-Sample T-Test?
Suppose you want to know whether there’s a difference in means between two data samples. That may mean wanting to see if there’s a difference between animal breeds – such as our collie and labrador example – or merely if there’s a difference between two randomized samples drawn from the same dataset.
That’s where a t-test is applicable. It’ll show you if there is a difference in the means between your samples, delivering insights into whatever data you’ve used in the process.
Applications in Research and Business
On the paired samples front, imagine that you’re a school teacher or perhaps an administrator who wants to analyze a teacher's effectiveness. Pre- and post-exam scores for students in a class are your target – you want to see if there’s a difference in the means between them.
A positive difference would show their lessons are working. Negative results, such as a drop in the mean score for the group, would tell the teacher that a revision of their lesson plans may be necessary. A two-sample -t-test is just what you need to figure out if lessons are achieving their objective of raising test scores.
For an independent example, consider what we said about dog heights earlier. Researchers may want that information to help them understand the genetics of different dog breeds, such as the whys and hows of how some breeds reach certain heights where others don’t. In both cases, sample means show the why—they highlight statistically significant differences using a random sample pulled from two groups of interest.
Types of Two-Sample T-Tests
We’ve touched on them both already, but there are two types of two-sample t-tests.
Independent (Unpaired) Two-Sample T-Test
An independent t-test is one where you pull your samples from two different groups, as in our dog comparison example. You’re looking for a significant difference between those groups, assuming any exists.
Functionally, the degrees of freedom afforded in this type of test is the sum of the observations in your dataset minus two. Your variables can be categorical, nominal, or offer a continuous measurement. Sample standard deviation is the norm for these types of two-sample tests.
Paired Two-Sample T-Test
Beyond the independent vs. paired aspect, including a paired two-sample t-test, your degrees of freedom with this test are different. You’ll need the number of paired observations in your sample minus one for this test. Sample standard deviation is still in effect; you only use the difference between your paired samples for a paired test.
There’s also the test’s purpose to consider – a paired test sees you determining whether the difference between your two samples is zero, while an independent test looks for equality between the mean values.
Assumptions of a Two-Sample T-Test
Before running either type of two-sample t-test, you must feel comfortable making the following assumptions about your data samples.
Normal Distribution of Data
Any deviations from the norm in your data objects are an issue. Your sample should match the Gaussian distribution bell curve, which signifies that your data has a normal distribution.
Equal Variance (Homogeneity)
Sticking with the data variance issue, homogeneity tells you that there are no wild swings in your data values. In other words, they’re “similar.”
Random Sampling and Independence
Picking and choosing which objects to pull from a dataset into a sample introduces bias to your two-sample t-test. Bias skews your results, hence the need for random sampling. It’s only when you sample randomly that you ensure your test is fair.
How to Conduct a Two-Sample T-Test in 5 Steps
Step 1: Define Your Hypothesis
Every t-test is about hypothesis testing. You start with a null hypothesis, which is that there will be zero variance between the mean you hypothesize and the one you get with your testing. Represent that null hypothesis as follows:
H0: µ = 0
“µ” is your hypothesized mean in this case (more on that in Step 4).
Then, there’s your alternative hypothesis – what you get when there is a difference in means. Represent that with the following:
Ha: µ ≠ 0
Step 2: Choose the Appropriate Test Type
Choosing your test type comes down to your samples from the data collected. If those samples come from two independent but related groups – i.e., our canine example – you need an independent two-sample t-test. If the groups are paired, choose the t-test with “paired” in the name.
Step 3: Gather and Prepare Data
Perhaps the simplest of the steps – as long as you remember that both data samples must contain randomized data objects. Don’t allow bias to creep into your results. Beyond that, sample size also matters – each sample should contain no more than 30 objects, or else you’ll need another type of statistical test.
Step 4: Perform the Test
Here’s where we get into the tricky aspects of running two-sample t-tests – using formulas. In both cases, you extract a t-value (also known as a t-score) represented by the “t” symbol. The differences lie in the formulas you use in each test.
Independent Two-Sample T-Test
We’ll start with an independent two-sample test. The following variables apply (and will also be used in the paired test):
X̅ = Sample Mean
μ = Hypothesized Mean
s = Sample Standard Deviation
n = Sample Size
You’ll also need a variable named Sp, which is your pooled standard variation. Once you have all of these numbers, plug them into the following equation:
t = x̅1 – x̅2 / Sp Ö1/n1 + 1/n2
Paired T-Test
Introducing differences into the mix means you’re dealing with more complex equations if you run a paired t-test. Beyond the symbols used in an independent test, you’ll also need the following:
D = Differences Between Your Two Paired Samples
di = The ith Observation Within D
d̅ = Sample Mean of the Differences
σ^ = Sample Standard Deviation of the Differences
From here, you don’t just have one equation to handle. You have three, starting with working out your sample mean using this formula:
d̅ = d1 + d2 + … + dn / n
With “d̅” squared away, your second equation gives you a figure for your sample standard deviation:
σ^ = Ö(d1 – d̅)2 + (d2 – d̅)2 + …. + (dn – d̅)2 / n – 1
Phew! That’s a lot of calculus already. Thankfully, the third of the paired t-test equations is much simpler:
t = d̅ - 0 / σ^ / Ön
Step 5: Interpret the Results
Regardless of the specific type of two-sample t-test you’re running, Step 4 gives you a t-value. Use that to find the p-value (probability value) for your test. This value tells you how likely it is that your null hypothesis is correct based on your t-value.
Using a t-distribution table (accounting for the degrees of freedom relevant to your t-test), find the alpha level for your results. We recommend using an online calculator or Julius AI to do this. Check that p-value against the alpha level you chose at the start of the test. If the p-value is less than the chosen alpha level, it’s likely your null hypothesis is accurate. In other words, there’s no significant difference between your hypothesized mean and what the data shows you.
Practical Examples of Two-Sample T-Tests
Though we’ve highlighted a couple of examples already, here are two more applications of two-sample t-tests in the real world.
Real-World Example: Comparing Test Scores Between Two Classes
A little spin on our previous test score example could see us finding the mean test scores across two classes studying the same subject. Only this time, you’ll use an independent test rather than a paired one. The reasoning is similar, though – you want to check teacher performance based on test scores.
Business Use Case: Evaluating Marketing Campaigns
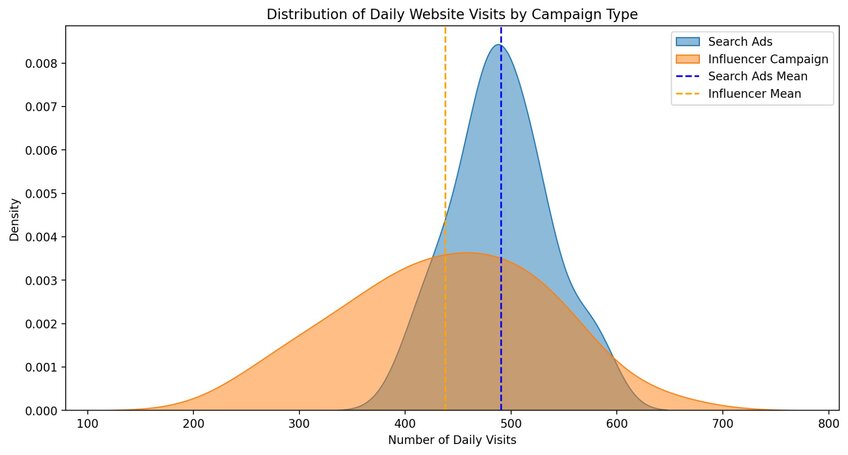
We mentioned that two-sample t-tests are similar to A/B testing before, and it’s here where you can see a real-world example. Let’s say you have a pair of marketing campaigns. Each takes a different approach, but you’re using the same metrics to determine their success – customer engagement, purchases, or whatever it may be.
You have a perfect candidate for a two-sample t-test. The metrics for these campaigns show you which is more effective. Campaign A may have a higher mean for purchases, for instance, showing you it’s doing a better job selling your product than Campaign B.

Tools for Performing a Two-Sample T-Test
Manual Calculations
Manual calculations are precisely what they say – you plug in numbers and solve equations to get your t and p-values. It’s long-winded. It’s tiresome. But most worrying is that working manually – albeit with the aid of calculators or a few spreadsheets – means you’re liable to make a few mistakes.
Software Solutions
Automation with software is the way to go if you want to guarantee, or at least enhance, the accuracy of your t-tests. Python and R are both excellent here, assuming you know how to code. For a no-code option powered by AI, Julius lets you upload and quiz your data samples (i.e., “What’s the t-value for these two sample sets?”) so you can get your answers quickly.
Common Errors and How to Avoid Them
If our earlier mention of errors has you sweating, it’ll help to know which you’re most likely to make with two-sample t-tests. Misinterpreting your p-value is a common one. Assuming you work it out correctly (Julius helps there), your null hypothesis is accurate if your p-value is lower than the alpha value you assigned at the start of the t-test.
Other than that, don’t ignore assumptions and always choose the right type of two-sample test.
Alternatives to a Two-Sample T-Test
Limited samples mean that a t-test isn’t always the best way to go if you need to determine a mean. You can also run into problems with assumptions. If they’re not what you need them to be, an alternative is in order.
Mann-Whitney U Test
Do you not have normalized data values? A two-sample t-test is out of the question, but a Mann-Whitney U Test can do the job. It’s capable of handling un-normalized datasets.
ANOVA for More Than Two Groups
One of the significant downfalls of a t-test is that it’s a statistical test for no more than two samples and just one if you’re using a one-sample t-test. ANOVA, which stands for “analysis of variance,” lets you find the mean when you have more than a couple of samples.
Discover How Julius Can Make Two-Sample T-Test and Other Statistical Analysis Simple
You could test statistical prowess by running two-sample t-tests manually. We already mentioned why that could be a problem – time and errors can happen. Or you could use Julius AI. Think of Julius as your AI chat assistant who just so happens to be a statistical expert. Once you’ve uploaded your data samples, you can ask Julius to run whichever type of t-test you want, and it’ll handle the rest.
Give Julius AI a try – make your two-sample t-test troubles a thing of the past.
Frequently Asked Questions (FAQs)
What is a two-sample t-test used for?
A two-sample t-test is used to compare the means of two data samples to determine if there is a statistically significant difference between them. These samples can come from two independent groups or be paired with data from the same group.
What is the difference between a two-sample t-test and an ANOVA?
A two-sample t-test compares the means of two groups, while an ANOVA (Analysis of Variance) is used when you need to compare the means of three or more groups. Both tests analyze mean differences, but ANOVA helps simultaneously identify variation across multiple groups.
How do you interpret the p-value for a two-sample t-test?
The p-value tells you whether the difference in means between your two samples is statistically significant. If the p-value is less than your chosen alpha level (commonly 0.05), you reject the null hypothesis, indicating a significant difference between the sample means.
Does a two-sample t-test assume normality?
Yes, a two-sample t-test assumes that the data samples come from populations with a normal distribution. If this assumption is violated, alternative tests like the Mann-Whitney U test may be more appropriate.
